
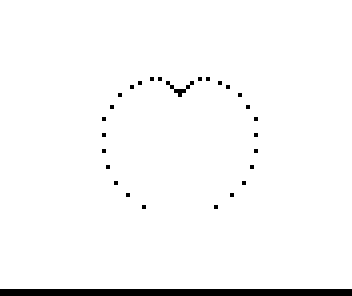
Plots a cardioid, a heart-shaped curve, with PLOT on the 8K ROM in 1K. The program steps an angle from PI to 0 and plots each point and its mirror image, so the curve builds up from both sides at once.
The author drew it as an attempt to describe the speed and apparent-wind diagram of a sail at a constant wind speed, to help predict the best sailing conditions.
Published in Syntax August 1982 (Cardioid Plot).
Image Gallery

Source Code
  10 FOR T=PI TO 0 STEP -.05*PI
  50 LET A=(1+COS T)*COS T
  60 LET B=(15*SQR ((1+COS T)**2-ABS A**2))
  70 LET X=32+B
  80 LET Y=30-15*A
  90 PLOT X,Y
 100 LET X=32-B
 110 PLOT X,Y
 120 NEXT T
 130 STOP
Note: Type-in program listings on this website use ZMAKEBAS notation for graphics characters.