Stock Market Tech Analysis 1 is a short-term stock market forecasting program that stores up to 30 weeks of price and signed volume data for up to six stocks across two 6×30 arrays. It computes several classic technical indicators including 4-week and 10-week moving averages, a weighted on-balance volume indicator, momentum analysis, overbought/oversold detection based on moving-average crossovers, and a composite point score used to generate BUY, SELL, or ALERT signals displayed in inverse video. Data entry uses a rolling-window update routine that shifts all 30 data points one position to accommodate a new entry. Graphs are drawn using PLOT for price and moving averages and character-cell printing for the volume indicator, with FAST/SLOW mode switching used to speed up calculations.
Program Analysis
Program Structure
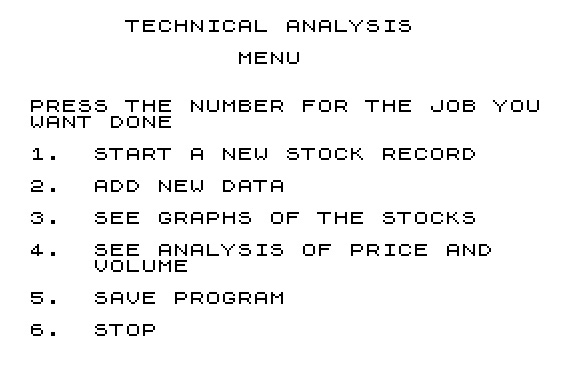
The program is organized as a menu-driven application with a title/splash screen at lines 90–99, a main menu at lines 100–180, and functional modules reached by keypress selection. The six major modules are:
- New stock entry (lines 200–297): collects name, date, and up to 30 price/volume pairs.
- Graph display (lines 300–499): price graph, 10-week and 4-week moving average graph, and volume indicator graph.
- Technical analysis (lines 500–779): computes six indicator sub-scores and a composite score.
- Data update (lines 960–1004): rolls the 30-entry window forward by one week.
- Error correction (lines 900–918): re-enters a specific data point.
- Save (lines 5000–5010): saves the program to tape.
Two subroutines support multiple callers: 780 (stock-selection menu) and 850 (weighted volume indicator calculation into array V). Additional subroutines at 425 (price axis labels), 440 (stock name/date header), 920 (exponentially weighted price array E and thrust analysis), and 2000 (BUY/SELL/ALERT signal display) are each called once.
Data Storage
All price data is stored in A(6,30) and signed volume data in B(6,30), where the first index is the stock number (1–6) and the second is the week (1–30). Volume is stored with a sign convention applied at entry time: zero if price is unchanged, negative if price fell. Stock names and dates are stored in six individual string variables (A$–F$ and U$–Z$) rather than a string array, which avoids the fixed-length-row constraint of DIM string arrays but limits the design to exactly six stocks.
Volume Indicator Calculation
The subroutine at line 850 builds a 27-element weighted on-balance volume array V. For the first four elements, a simple weighted sum of four consecutive B values is used (weights 1, 1.2, 1.6, 2.0). From element 5 onward, each value is half the value four positions back plus the same weighted sum, creating a recursive exponential decay. The high and low of V are then found, clamped so the high is at least 0 and the low is at most 0, and the range H1 is computed for graph scaling.
Technical Indicators and Scoring
The analysis section (lines 500–717) computes a composite score stored in the three-element array C(3), representing the current week and the two prior weeks. Six sub-indicators each contribute a signed integer to the score:
| Indicator | Variable | Lines |
|---|---|---|
| 6-week trend direction | W | 508–540 |
| Short-term trend (weighted price array E) | LL | 546–573 |
| Momentum (rate-of-change comparison) | F | 577–604 |
| Thrust pattern (price movement vs. average range) | J | 920–952 via GOSUB 920 |
| Overbought/oversold (moving-average divergence) | LD | 629–654 |
| Volume pressure score | K | 670–717 |
The BUY/SELL/ALERT signals at lines 2000–2050 compare the current score C(3) against thresholds (±8, ±10) and check the direction of the prior two scores to confirm trend continuation or reversal. Signals are printed in inverse video characters.
Graph Drawing
Price graphs (line 381) use PLOT with X scaled as 2*N+1 and Y scaled as (40/D)*(A(X,N)-S), mapping 30 data points across the 64-pixel-wide screen. The 10-week moving average (line 396) is printed as asterisk characters using PRINT AT with a row calculated from the price scale, while the 4-week average (line 407) uses PLOT. The volume indicator graph (line 485) uses PLOT with its own independent scale derived from H1 and F1. Price axis labels (subroutine 425) display values at five evenly spaced rows corresponding to the high, 75%, midpoint, 25%, and low of the price range, with a special case at line 435 for prices over 99 that drops the decimal.
Key BASIC Idioms
- The main menu keypress loop at lines 150–180 first waits for any key (
150), then tests each digit in sequence. Because INKEY$ is sampled anew on each line, a fast typist could cause the wrong branch to be taken — a classic race-condition issue with this idiom. FAST/SLOWmode switching brackets all computationally intensive loops to maximize speed while still allowing readable screen output.- The data-update routine at lines 965–970 shifts the array with a simple
FOR N=1 TO 29loop copyingA(X,N)=A(X,N+1), then writes the new entry into position 30. - The
STOPat line 295 (and 385, 410, 489, 772) is used deliberately as a breakpoint, with the user expected to press CONT to resume or typeGOTOto branch — a common technique for programs that need to pause for user inspection of a graph before continuing. VAL "number"is not used; allGOTO/GOSUBtargets are literal line numbers.
Bugs and Anomalies
- The variable
Xis used both as the stock-selection index (set by the subroutine at line780) and as the loop variable in theFOR X=1 TO 6loop at line 203. The subroutine at 780 setsXviaINKEY$comparisons rather than aFORloop, so this does not directly conflict, but reuse ofXas both a stock index and a FOR-loop variable is fragile. - Similarly, the string variable
X$(used at line 256 and 730 etc. to hold the date for stock 4) shares its name with the loop variableXonly in appearance — in BASIC these are distinct — but visually confusing for maintainability. - At line 422,
GOTO 462is reached only if execution falls through from line 410’sSTOPwith aCONT, bypassing theRETURNat 436; this is intentional flow control to jump to the volume graph processing block. - The variable
E(a scalar) is overwritten at lines 549–557 inside a loop that also references arrayE()declared at line 920 — both namedE. In Sinclair BASIC, a scalar and a dimensioned array cannot share the same name; theDIM E(27)at line 920 would erase any scalarE, and subsequent use of scalarEat lines 549–599 conflicts with the array. This is a genuine bug that would produce a variable-not-found or type error at runtime depending on execution order. - Line 508 uses
FOR Y=2 TO 0 STEP -1and later lines 546, 577, 629, 670 repeat the same loop, iterating Y over 2, 1, 0 to process the current and two prior weeks. However, the variableYis also used as a data-row index elsewhere (lines 270–287), relying on the fact that no other code is running concurrently — acceptable in single-threaded BASIC. - At line 532,
IF A AND B=ABis syntactically parsed asIF (A) AND (B=AB), which tests whether the scalarAis non-zero and whetherBequalsAB— this may not be the intended logical condition. - Line 758 references
Q$andR$, and line 762 referencesJ, all of which are set inside subroutine920(called at line 545). The variableJretains its last value from theFOR Yloop at line 931, which corresponds toY=0(the most recent week) — this is intentional.
Content
Image Gallery
Source Code
  20 REM "STOCKS"
  50 DIM A(6,30)
  55 DIM B(6,30)
  60 LET A$=""
  61 LET B$=""
  62 LET C$=""
  63 LET D$=""
  64 LET E$=""
  65 LET F$=""
  90 PRINT AT 2,3;"(TURN OFF TAPE RECORDER)"
  91 PRINT AT 7,4;"""TECHNICAL ANALYSIS I"""
  92 PRINT AT 10,0;"SHORT-TERM STOCK MARKET FORCAST"
  94 PRINT AT 18,1;"COPYRIGHT 1982, T. H. NOOTER"
  96 PRINT AT 19,8;"DISTRIBUTED BY"
  97 PRINT AT 20,5;"TIMEX COMPUTER CORP."
  99 STOP
 100 CLS
 101 PRINT TAB 6;"TECHNICAL ANALYSIS"
 103 PRINT
 105 PRINT TAB 13;"MENU"
 106 PRINT
 109 PRINT
 110 PRINT "PRESS THE NUMBER FOR THE JOB YOUWANT DONE"
 115 PRINT
 116 PRINT "1.  START A NEW STOCK RECORD"
 117 PRINT
 120 PRINT "2.  ADD NEW DATA"
 121 PRINT
 125 PRINT "3.  SEE GRAPHS OF THE STOCKS"
 126 PRINT
 130 PRINT "4.  SEE ANALYSIS OF PRICE AND       VOLUME"
 131 PRINT
 132 PRINT "5.  SAVE PROGRAM"
 133 PRINT
 135 PRINT "6.  STOP"
 150 IF INKEY$="" THEN GOTO 150
 155 IF INKEY$="1" THEN GOTO 200
 160 IF INKEY$="2" THEN GOTO 960
 170 IF INKEY$="3" THEN GOTO 300
 175 IF INKEY$="4" THEN GOTO 500
 176 IF INKEY$="5" THEN GOTO 5000
 178 IF INKEY$<>"" THEN STOP
 180 GOTO 100
 200 CLS
 203 FOR X=1 TO 6
 205 IF A(X,30)=0 THEN GOTO 218
 206 NEXT X
 212 PRINT "YOU ALREADY HAVE SIX STOCKS; "
 213 PRINT "TO CLEAR OUT A LINE FOR A NEW   ONE, PRESS 9;"
 214 PRINT "OTHERWISE PRESS 0 FOR MENU"
 215 IF INKEY$="" THEN GOTO 215
 216 IF INKEY$="9" THEN GOTO 840
 217 IF INKEY$<>"" THEN GOTO 100
 218 CLS
 219 PRINT "THIS STOCK WILL BE NUMBER ";X;";    PRINT THE NAME"
 235 IF X=1 THEN INPUT A$
 237 IF X=2 THEN INPUT B$
 240 IF X=3 THEN INPUT C$
 242 IF X=4 THEN INPUT D$
 244 IF X=5 THEN INPUT E$
 246 IF X=6 THEN INPUT F$
 248 PRINT "PUT IN THE LAST TRADE DATE"
 250 IF X=1 THEN INPUT U$
 252 IF X=2 THEN INPUT V$
 254 IF X=3 THEN INPUT W$
 256 IF X=4 THEN INPUT X$
 257 IF X=5 THEN INPUT Y$
 259 IF X=6 THEN INPUT Z$
 260 CLS
 265 PRINT "ENTER PRICE, THEN VOLUME; USE   ONLY THE FIRST TWO FIGURES FOR  VOLUME"
 270 FOR Y=1 TO 30
 275 INPUT A(X,Y)
 278 PRINT Y;". ";A(X,Y);
 280 INPUT B(X,Y)
 281 IF Y=1 THEN GOTO 285
 282 IF A(X,Y)=A(X,Y-1) THEN LET B(X,Y)=0
 283 IF A(X,Y)<A(X,Y-1) THEN LET B(X,Y)=-B(X,Y)
 285 PRINT ";";B(X,Y),
 287 NEXT Y
 290 PRINT "IF THERE IS AN ERROR, NOTE THE  NUMBER OF THE WRONG ENTRY AND   PRESS GOTO 900"
 293 PRINT "OTHERWISE, PRESS CONT"
 295 STOP
 297 GOTO 100
 300 CLS
 303 PRINT "CHOOSE A STOCK BY NUMBER"
 307 GOSUB 780
 310 FAST
 330 LET L=A(X,1)
 332 LET S=A(X,1)
 335 FOR N=2 TO 30
 340 IF A(X,N)>L THEN LET L=A(X,N)
 345 IF A(X,N)<S THEN LET S=A(X,N)
 350 NEXT N
 355 LET D=L-S
 357 CLS
 370 GOSUB 440
 372 GOSUB 425
 380 FOR N=1 TO 30
 381 PLOT 2*N+1,(40/D)*(A(X,N)-S)
 382 NEXT N
 383 SLOW
 385 STOP
 387 FAST
 388 CLS
 389 GOSUB 440
 390 PRINT TAB 9;"MOVING AVERAGES"
 391 GOSUB 425
 392 FOR N=10 TO 30
 394 LET T=(A(X,N-9)+A(X,N-8)+A(X,N-7)+A(X,N-6)+A(X,N-5)+A(X,N-4)+A(X,N-3)+A(X,N-2)+A(X,N-1)+A(X,N))/10
 396 PRINT AT 21-20/D*(T-S),N;"*"
 398 NEXT N
 400 FOR N=4 TO 30
 405 LET M=(A(X,N-3)+A(X,N-2)+A(X,N-1)+A(X,N))/4
 407 PLOT 2*N,40/D*(M-S)
 408 NEXT N
 409 SLOW
 410 STOP
 422 GOTO 462
 425 PRINT AT 1,0;.1*INT (L*10)
 427 PRINT AT 6,0;.1*INT (((L-S)*.75+S)*10)
 429 PRINT AT 11,0;.1*INT (((L+S)/2)*10)
 431 PRINT AT 16,0;.1*INT (((L-S)/4+S)*10)
 432 IF S>99 THEN GOTO 435
 433 PRINT AT 21,0;.1*INT (S*10)
 434 GOTO 436
 435 PRINT AT 21,0;INT S
 436 RETURN
 440 IF X=1 THEN PRINT TAB 9;A$;", ";U$
 445 IF X=2 THEN PRINT TAB 9;B$;", ";V$
 450 IF X=3 THEN PRINT TAB 9;C$;", ";W$
 455 IF X=4 THEN PRINT TAB 9;D$;", ";X$
 457 IF X=5 THEN PRINT TAB 9;E$;", ";Y$
 458 IF X=6 THEN PRINT TAB 9;F$;", ";Z$
 460 RETURN
 462 PRINT AT 10,3;"PROCESSING VOLUME DATA"
 463 PAUSE 60
 464 CLS
 465 FAST
 466 GOSUB 850
 468 PRINT "PRICE"
 469 PRINT AT 11,0;"VOLUME INDICATOR"
 471 FOR N=1 TO 30
 473 PLOT 2*N,18/D*(A(X,N)-S)+22
 475 NEXT N
 477 PRINT AT 21-(9/H1*(0-F1)),0;"0"
 478 PRINT AT 21-(9/H1*(0-F1)),31;"0"
 479 PRINT AT 21-(9/H1*(0-F1)),2;"............................"
 480 FOR N=1 TO 27
 485 PLOT 2*N+6,18/H1*(V(N)-F1)
 486 NEXT N
 487 SLOW
 489 STOP
 490 CLS
 491 PRINT AT 5,0;"TO SEE A GRAPH AGAIN, PRESS ""1"" FOR PRICE, ""2"" FOR MOVING       AVERAGE,OR ""3"" FOR VOLUME;"
 492 PRINT "T0 SEE GRAPHS OF OTHER STOCKS,  PRESS ""9""; OTHERWISE PRESS ""0""  FOR MENU"
 493 IF INKEY$="" THEN GOTO 493
 494 IF INKEY$="1" THEN GOTO 310
 495 IF INKEY$="2" THEN GOTO 387
 496 IF INKEY$="3" THEN GOTO 464
 497 IF INKEY$="9" THEN GOTO 300
 498 IF INKEY$<>"" THEN GOTO 100
 499 STOP
 500 CLS
 501 PRINT "CHOOSE THE STOCK BY NUMBER"
 502 GOSUB 780
 503 CLS
 504 PRINT AT 10,6;"PROCESSING DATA"
 505 PAUSE 60
 506 DIM C(3)
 507 FAST
 508 FOR Y=2 TO 0 STEP -1
 509 LET AB=0
 510 LET A=0
 511 LET B=0
 512 FOR N=16 TO 25
 514 LET A=A(X,N-Y)+A
 516 NEXT N
 518 FOR N=21 TO 30
 520 LET B=A(X,N-Y)+B
 522 NEXT N
 523 FOR N=19 TO 28
 524 LET AB=A(X,N-Y)+AB
 525 NEXT N
 529 IF B>=AB-AB/500 AND B<=AB+AB/500 THEN GOTO 536
 531 IF AB=A THEN LET W=1
 532 IF A AND B=AB THEN GOTO 536
 533 IF SGN (B-AB)=SGN (A-AB) THEN LET W=2
 534 IF SGN (B-AB)=SGN (AB-A) THEN LET W=1
 535 GOTO 539
 536 LET W=0
 537 GOTO 540
 538 LET W=1
 539 IF AB>B THEN LET W=-W
 540 LET C(3-Y)=W
 541 NEXT Y
 542 IF AB<B THEN LET M$="UP"
 543 IF AB>B THEN LET M$="DOWN"
 544 IF B<=AB+AB/500 AND B>=AB-AB/500 THEN LET M$="NEUTRAL"
 545 GOSUB 920
 546 FOR Y=2 TO 0 STEP -1
 547 LET C=.1*INT (10*E(24-Y))
 548 LET D=.1*INT (10*E(25-Y))
 549 LET E=.1*INT (10*E(26-Y))
 550 LET FG=.1*INT (10*E(27-Y))
 552 IF FG<=E+E/1000 AND FG>=E-E/1000 THEN GOTO 572
 553 IF FG>E THEN GOTO 560
 554 LET C=-C
 555 LET D=-D
 556 LET E=-E
 557 LET FG=-FG
 560 IF E=D AND D>=C THEN LET LL=2
 562 IF E>D AND D<=C THEN LET LL=3
 564 IF E=D AND D<C THEN LET LL=3
 566 IF E<D AND D>=C THEN LET LL=1
 567 IF E>D AND D>C THEN LET LL=2
 568 IF E<D AND D<C THEN LET LL=2
 569 IF E(27-Y)<E(26-Y) THEN LET LL=-LL
 570 GOTO 572
 571 LET LL=0
 572 LET C(3-Y)=C(3-Y)+LL
 573 NEXT Y
 574 IF LL>0 THEN LET N$=" UP"
 575 IF LL=0 THEN LET N$=" NEUTRAL"
 576 IF LL<0 THEN LET N$=" DOWN"
 577 FOR Y=2 TO 0 STEP -1
 578 LET FG=E(27-Y)
 579 LET E=E(26-Y)
 580 LET D=E(25-Y)
 581 LET C=E(24-Y)
 582 IF ABS (FG-E)>ABS (E-D) THEN LET F=1
 588 IF ABS (FG-E)<=ABS (E-D) THEN LET F=0
 590 IF FG<E THEN LET F=-F
 592 LET C(3-Y)=C(3-Y)+F
 593 NEXT Y
 596 IF F<>0 THEN LET O$="INCREASING"
 597 IF F=0 THEN LET O$="DECREASING"
 598 IF FG>E THEN LET P$=" UPSIDE"
 599 IF FG<E THEN LET P$=" DOWNSIDE"
 600 IF FG=E THEN LET P$=""
 602 IF ABS (FG-E)=ABS (E-D) THEN LET O$="NEUTRAL"
 604 IF ABS (FG-E)=ABS (E-D) THEN LET P$=""
 628 DIM G(21)
 629 FOR Y=2 TO 0 STEP -1
 630 LET OV=0
 631 LET U=0
 632 LET T=0
 633 LET LD=0
 634 LET OVA=1
 635 FOR N=12-Y TO 30-Y
 637 LET T=(A(X,N-9)+A(X,N-8)+A(X,N-7)+A(X,N-6)+A(X,N-5)+A(X,N-4)+A(X,N-3)+A(X,N-2)+A(X,N-1)+A(X,N))/10
 638 LET U=(A(X,N-3)+A(X,N-2)+A(X,N-1)+A(X,N))/4
 639 LET G(N-9)=T-U
 640 NEXT N
 641 FOR N=5-Y TO 20-Y
 642 IF SGN G(N)<>SGN G(N+1) THEN LET OVA=0
 643 IF OV<ABS G(N+1) THEN LET OV=ABS G(N+1)
 645 NEXT N
 650 IF OV=ABS G(21-Y) THEN LET LD=1
 652 LET LD=LD+OVA
 653 IF G(21-Y)<0 THEN LET LD=-LD
 654 LET C(3-Y)=C(3-Y)+LD
 655 NEXT Y
 656 IF LD>0 THEN LET L$=" OVERSOLD"
 658 IF LD<0 THEN LET L$=" OVERBOUGHT"
 660 IF LD=0 THEN LET L$=" NEUTRAL"
 664 LET EGG=0
 665 GOSUB 850
 666 FOR N=1 TO 30
 667 LET EGG=A(X,N)+EGG
 668 NEXT N
 669 LET EGG=EGG/30
 670 FOR Y=2 TO 0 STEP -1
 671 LET VOL=0
 672 LET OL=0
 674 LET UME=0
 676 LET ME=0
 677 LET K=0
 680 FOR N=30-Y TO 21-Y STEP -1
 685 IF B(X,N)>0 THEN LET VOL=B(X,N)+VOL
 687 IF B(X,N)>0 THEN LET OL=OL+1
 690 IF B(X,N)<0 THEN LET UME=B(X,N)+UME
 693 IF B(X,N)<0 THEN LET ME=ME+1
 695 NEXT N
 696 IF OL=0 THEN GOTO 698
 697 LET VOL=VOL/OL
 698 IF ME=0 THEN GOTO 700
 699 LET UME=UME/ME
 700 IF V(27-Y)=0 THEN LET K=0
 702 IF V(27-Y)>0 THEN GOTO 708
 704 IF V(27-Y)<V(25-Y) THEN LET K=-1
 706 GOTO 710
 708 IF V(27-Y)>V(25-Y) THEN LET K=1
 710 IF V(27-Y)>0 THEN LET K=K+3
 712 IF V(27-Y)<0 THEN LET K=K-3
 713 IF VOL>ABS (UME) THEN LET K=K+1
 714 IF VOL<ABS (UME) THEN LET K=K-1
 715 IF (V(27-Y)>0) AND (A(X,30-Y)<EGG) THEN LET K=K+1
 716 IF (V(27-Y)<0) AND (A(X,30-Y)>EGG) THEN LET K=K-1
 717 LET C(3-Y)=C(3-Y)+K
 718 NEXT Y
 720 CLS
 725 SLOW
 726 IF X=1 THEN PRINT A$,U$
 727 IF X=2 THEN PRINT B$,V$
 729 IF X=3 THEN PRINT C$,W$
 730 IF X=4 THEN PRINT D$,X$
 732 IF X=5 THEN PRINT E$,Y$
 733 IF X=6 THEN PRINT F$,Z$
 735 PRINT "================================"
 736 PRINT AT 3,11;"ANALYSIS       POINTS"
 737 PRINT AT 4,11;"""""""""""""""""       """""""""""""
 738 PRINT AT 5,0;"6-WEEK TREND IS ";M$
 740 PRINT AT 5,29;W
 744 PRINT AT 7,0;"SHORT-TERM TREND IS ";N$
 746 PRINT AT 7,29;LL
 750 PRINT AT 9,0;"THERE IS ";O$
 752 PRINT P$;" MOMENTUM"
 754 PRINT AT 10,29;F
 758 PRINT AT 12,0;"THE STOCK IS ";Q$;R$
 762 PRINT AT 12,29;J
 763 PRINT AT 14,0;"THE BUY/SELL PRESSURE IS"
 764 PRINT AT 15,0;L$
 765 PRINT AT 14,29;LD
 766 PRINT AT 17,0;"VOLUME SCORE IS:"
 767 PRINT AT 17,29;K
 768 PRINT AT 19,11;"TOTAL SCORE IS  ";C(3)
 769 PRINT AT 21,0;"PRIOR SCORES ARE ";C(1);", ";C(2)
 770 GOSUB 2000
 772 STOP
 773 PRINT AT 7,0;"FOR ANALYSIS OF OTHER STOCKS,   PRESS ""1""; FOR GRAPHS, PRESS ""2""FOR MENU, PRESS ""0"""
 774 IF INKEY$="" THEN GOTO 774
 775 IF INKEY$="2" THEN GOTO 300
 776 IF INKEY$="0" THEN GOTO 100
 777 IF INKEY$<>"" THEN GOTO 500
 778 CLS
 779 STOP
 780 PRINT AT 4,4;"1.  ";A$;", ";U$
 781 IF B$="" THEN GOTO 820
 782 PRINT AT 6,4;"2.  ";B$;", ";V$
 783 IF C$="" THEN GOTO 820
 784 PRINT AT 8,4;"3.  ";C$;", ";W$
 785 IF D$="" THEN GOTO 820
 786 PRINT AT 10,4;"4.  ";D$;", ";X$
 795 IF E$="" THEN GOTO 820
 798 PRINT AT 12,4;"5.  ";E$;", ";Y$
 800 IF F$="" THEN GOTO 820
 805 PRINT AT 14,4;"6.  ";F$;", ";Z$
 820 IF INKEY$="" THEN GOTO 820
 824 IF INKEY$="1" THEN LET X=1
 828 IF INKEY$="2" THEN LET X=2
 832 IF INKEY$="3" THEN LET X=3
 834 IF INKEY$="4" THEN LET X=4
 836 IF INKEY$="5" THEN LET X=5
 837 IF INKEY$="6" THEN LET X=6
 838 IF INKEY$="0" THEN GOTO 100
 839 RETURN
 840 CLS
 841 PRINT "PICK THE STOCK YOU WISH TO      ELIMINATE BY NUMBER"
 842 GOSUB 780
 843 FAST
 844 FOR N=1 TO 30
 845 LET A(X,N)=0
 846 LET B(X,N)=0
 847 NEXT N
 848 SLOW
 849 GOTO 218
 850 DIM V(27)
 851 FOR N=1 TO 4
 853 LET V(N)=B(X,N)+1.2*B(X,N+1)+1.6*B(X,N+2)+2*B(X,N+3)
 854 NEXT N
 855 FOR N=5 TO 27
 860 LET V(N)=V(N-4)/2+B(X,N)+1.3*B(X,N+1)+1.6*B(X,N+2)+2*B(X,N+3)
 865 NEXT N
 882 LET K1=V(1)
 883 LET F1=V(1)
 884 FOR N=2 TO 27
 886 IF V(N)>K1 THEN LET K1=V(N)
 888 IF V(N)<F1 THEN LET F1=V(N)
 890 NEXT N
 892 IF K1<0 THEN LET K1=0
 893 IF F1>0 THEN LET F1=0
 894 LET H1=K1-F1
 898 RETURN
 900 CLS
 902 PRINT "INPUT THE NUMBER OF THE WRONG   ENTRY"
 904 INPUT Y
 906 PRINT " INPUT THE CORRECT PRICE AND VOL"
 907 INPUT A(X,Y)
 908 PRINT A(X,Y),
 909 INPUT B(X,Y)
 910 IF Y=1 THEN GOTO 913
 911 IF A(X,Y)=A(X,Y-1) THEN LET B(X,Y)=0
 912 IF A(X,Y)<A(X,Y-1) THEN LET B(X,Y)=-B(X,Y)
 913 PRINT B(X,Y)
 914 PRINT " FOR MORE CORRECTIONS, PRESS     GOTO 900, OTHERWISE,PRESS CONT"
 916 STOP
 918 GOTO 100
 920 DIM E(27)
 921 FOR N=1 TO 27
 923 LET E(N)=A(X,N)+1.3*A(X,N+1)+1.6*A(X,N+2)+2*A(X,N+3)
 924 NEXT N
 925 LET AVE=0
 927 FOR N=3 TO 30
 928 LET AVE=ABS (A(X,N)-A(X,N-1))+AVE
 929 NEXT N
 930 LET AVE=AVE/16
 931 FOR Y=2 TO 0 STEP -1
 932 IF ABS (A(X,30-Y)-A(X,28-Y))<AVE THEN GOTO 945
 935 LET J=2
 937 IF ABS (A(X,29-Y)-A(X,27-Y))>AVE THEN LET J=1
 938 IF J=2 THEN GOTO 941
 939 IF SGN (A(X,28-Y)-A(X,26-Y))<>SGN (A(X,30-Y)-A(X,28-Y)) THEN LET J=J+1
 941 IF A(X,28-Y)>A(X,30-Y) THEN LET J=-J
 943 GOTO 946
 945 LET J=0
 946 LET C(3-Y)=C(3-Y)+J
 947 NEXT Y
 948 LET Q$=""
 949 LET R$=""
 950 IF J<>0 THEN LET Q$="THRUSTING"
 951 IF J>0 THEN LET R$=" UP"
 952 IF J<0 THEN LET R$=" DOWN"
 953 IF J=0 THEN LET Q$="BASING"
 955 RETURN
 960 CLS
 961 PRINT "CHOOSE THE STOCK YOU WISH TO    UPDATE, BY NUMBER"
 962 GOSUB 780
 963 CLS
 964 FAST
 965 FOR N=1 TO 29
 966 LET A(X,N)=A(X,N+1)
 968 LET B(X,N)=B(X,N+1)
 970 NEXT N
 971 SLOW
 973 CLS
 974 PRINT AT 7,0;" INPUT THE PRICE, THEN THE       VOLUME"
 976 INPUT A(X,30)
 977 PRINT A(X,30),
 978 INPUT B(X,30)
 980 IF A(X,30)=A(X,29) THEN LET B(X,30)=0
 982 IF A(X,30)<A(X,29) THEN LET B(X,30)=-B(X,30)
 984 PRINT B(X,30)
 985 PRINT "TO ADD MORE DATA, PRESS ""1""; IF DONE, PRESS ""0"";"
 986 PRINT "TO CORRECT AN ERROR, PRESS ""5""  AND RE-ENTER PRICE AND VOLUME."
 987 IF INKEY$="" THEN GOTO 987
 988 IF INKEY$="1" THEN GOTO 963
 989 IF INKEY$="5" THEN GOTO 973
 990 CLS
 991 PRINT "ENTER NEW DATE"
 992 IF X=1 THEN INPUT U$
 993 IF X=2 THEN INPUT V$
 994 IF X=3 THEN INPUT W$
 995 IF X=4 THEN INPUT X$
 996 IF X=5 THEN INPUT Y$
 997 IF X=6 THEN INPUT Z$
 998 CLS
 999 PRINT AT 10,0;"TO UPDATE ANOTHER STOCK, PRESS  ""1""; FOR MENU, PRESS ""0"""
 1000 IF INKEY$="" THEN GOTO 1000
 1002 IF INKEY$="1" THEN GOTO 960
 1004 GOTO 100
 1005 CLS
 1009 STOP
 2000 IF C(3)>8 AND C(2)>0 AND (C(3)>C(2) AND C(2)>C(1)) THEN PRINT AT 21,25;"%B%U%Y"
 2010 IF C(3)<-8 AND C(2)<0 AND (C(3)<C(2) AND C(2)<C(1)) THEN PRINT AT 21,25;"%S%E%L%L"
 2020 IF (C(2)<-1 AND C(3)>10) THEN PRINT AT 21,25;"%B%U%Y"
 2030 IF (C(2)>1 AND C(3)<-10) THEN PRINT AT 21,25;"%S%E%L%L"
 2040 IF (SGN C(1)<>SGN (C(2))) AND (SGN (C(3))=SGN (C(2))) THEN PRINT AT 21,25;"%A%L%E%R%T"
 2050 RETURN
 5000 CLS
 5001 PRINT AT 7,0;"START RECORDER ON ""RECORD"" AND  PRESS ""CONT"" AND ""ENTER"""
 5002 STOP
 5005 SAVE "STOCK%S"
 5010 GOTO 90
Note: Type-in program listings on this website use ZMAKEBAS notation for graphics characters.