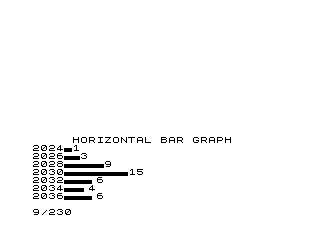
This program renders a horizontal bar graph on screen, prompting the user to enter a starting year, the number of bars, and a time increment between years. For each bar, it accepts a numeric value and draws a horizontal line of plotted points using the ZX81’s PLOT command, starting at column 8 and extending to column Z+8. The year label is printed to the left of each bar, and the numeric value is printed to the right, with the display scrolling between entries. The use of PLOT within a FOR loop to build each bar is a characteristic technique for producing rudimentary graphics on text-based display hardware.
Program Analysis
Program Structure
The program is a straightforward linear sequence with two nested FOR loops. The outer loop (lines 130–220) iterates N times, once per bar. The inner loop (lines 170–190) draws each individual bar using PLOT. After all bars are drawn, the program halts at line 230.
- Initialisation (lines 20–90): Collects starting year (
D), number of bars (N), and year increment (A) viaINPUT. - Header (lines 110–120): Scrolls and prints the graph title centred with
TAB 5. - Bar drawing loop (lines 130–220): For each iteration, scrolls the display, inputs value
Z, prints the current year labelD, plots the bar, printsZas a right-side label, and advances the year byA.
Variable Usage
| Variable | Purpose |
|---|---|
D | Current year label, incremented by A each iteration |
N | Total number of bars to draw |
A | Year increment between bars |
I | Outer loop counter |
Z | Data value for current bar |
X | Inner loop counter / horizontal plot position |
PLOT-Based Bar Drawing
Each bar is drawn by the inner FOR X=8 TO Z+8 loop, calling PLOT X,0 repeatedly. The bar always starts at column 8 (leaving room for the year label printed just before) and extends to column Z+8, so the bar length in pixels equals Z. The Y coordinate is fixed at 0, meaning all points are plotted on a single pixel row. This produces a thin one-pixel-high horizontal line rather than a filled bar.
Key BASIC Idioms
- SCROLL before each bar:
SCROLLat lines110and140shifts the display up one line, preventing the screen from filling and pausing — an important consideration on hardware with no automatic scroll prompt control. - Interleaved labels and graphics: Printing
D(year) before thePLOTloop andZ(value) after provides left and right annotations for each bar, though both appear on separate text lines rather than inline with the plotted pixels. - Year auto-increment:
LET D=D+Aat line210advances the year counter generically, supporting any regular interval (annual, biennial, decadal, etc.).
Bugs and Anomalies
- No input validation: If
Zis negative, theFOR X=8 TO Z+8loop body never executes and no bar is drawn, silently producing an empty row. - Fixed Y coordinate:
PLOT X,0always plots at row 0. On a ZX81, row 0 is at the bottom of the graphics area, so all bars share a common baseline, which is actually correct for a bar chart — however, the bars are only one pixel tall, making them visually thin lines rather than solid bars. - Screen width limit: The ZX81 display is 64 pixels wide. If
Zexceeds approximately 55, the plot coordinates will overflow the screen without error checking, potentially causing an out-of-screen-bounds error or wrapping, depending on the implementation. - Line 100 is missing: The line numbering jumps from
90to110, leaving a gap that has no functional effect but suggests a line was deleted during editing.
Content
Image Gallery
Source Code
  10 REM HORIZONTAL BAR GRAPH
  20 PRINT "ENTER STARTING YEAR"
  30 INPUT D
  40 PRINT
  50 PRINT "ENTER NR BARS DESIRED"
  60 INPUT N
  70 PRINT
  80 PRINT "ENTER TIME BETWEEN YEARS"
  90 INPUT A
 110 SCROLL
 120 PRINT TAB 5;"HORIZONTAL BAR GRAPH"
 130 FOR I=1 TO N
 140 SCROLL
 150 INPUT Z
 160 PRINT D
 170 FOR X=8 TO Z+8
 180 PLOT X,0
 190 NEXT X
 200 PRINT Z
 210 LET D=D+A
 220 NEXT I
 230 STOP
 240 SAVE "1014%0"
 250 RUN
Note: Type-in program listings on this website use ZMAKEBAS notation for graphics characters.